If you are running LinkedIn outreach in 2026 and wondering whether your 12% reply rate is good or garbage, this post will give you the actual numbers. Not guesses. Not what some tool vendor wants you to believe so you buy their product. Real benchmarks from real campaigns, including data from 285,000+ messages we have sent through Sbl.so over the past year.
By the end of this, you will know exactly where your connection acceptance rate, message reply rate, and InMail performance should land in 2026. And you will understand why the “industry average” numbers floating around are often misleading.
The LinkedIn Outreach Reply Rate Benchmark Everyone Gets Wrong
Let me start with the number everyone asks about. What is a good LinkedIn reply rate in 2026?
Here is the honest answer based on what we see across thousands of campaigns:
- Average first-touch reply rate: 8 to 12%
- Good reply rate: 18 to 25%
- Elite reply rate: 30% or higher on the first message
Most people quoting “5% is good” are pulling numbers from 2022 or conflating LinkedIn with cold email. Those are different channels with different dynamics. If your LinkedIn outreach is only getting 5% replies, you are underperforming the platform in 2026.
Across our own data at Sbl.so, we are seeing an 18% average reply rate across 285,000+ messages. That puts us solidly in the “good” range, and some of our tighter campaigns push well above 25%. The difference? Targeting and message quality. Not magic.
Connection Acceptance Rate Benchmarks for 2026
Before anyone replies to your message, they need to accept your connection request. This is where a lot of outreach campaigns silently die.
What is a good LinkedIn connection acceptance rate in 2026?
- Below average: Under 20%
- Average: 20 to 30%
- Good: 30 to 45%
- Top performers: 40 to 60%
If you are sitting below 25%, something is broken. Usually it is one of these:
- Your profile looks like a sales robot (bad photo, generic headline, no content)
- Your targeting is too broad
- You are sending connection notes that scream “I want to sell you something”
Here is a pattern we have noticed that might surprise you: in many segments, sending no connection note at all outperforms sending a note. The theory is that notes trigger the “sales pitch incoming” filter in people’s heads. A blank request feels more like a genuine professional connection.
We tested this across 47 campaigns last year. No-note requests averaged 38% acceptance. Requests with a short intro note averaged 29%. Not a huge gap, but consistent enough that we now default to no-note for most cold campaigns.
Account Age and SSI Score Impact
Two factors that rarely get discussed: account age and Social Selling Index score.
Newer LinkedIn accounts (under 6 months old) consistently see lower acceptance rates. LinkedIn’s algorithm seems to throttle new accounts more aggressively, and prospects are more suspicious of profiles with thin history. If you are scaling outreach using fractional SDR profiles or rented accounts, the age of those profiles matters.
SSI score correlation is real but overblown. We have seen accounts with 70+ SSI underperform accounts with 45 SSI because the higher-SSI account was targeting the wrong people. SSI helps at the margins, but it cannot fix bad targeting or weak messaging.
InMail Performance After the 87% Cap Cut
If you use LinkedIn Sales Navigator, you have probably noticed InMail credits got squeezed hard in 2025. The effective cap dropped, which forced a lot of teams to be more selective with InMails.
Current InMail reply rate benchmarks for 2026:
- Average: 5 to 10%
- Good: 10 to 15%
- Great: 15%+ (rare, requires tight targeting)
InMail generally underperforms direct messages to connections. But it has one advantage: you can reach people who have not accepted your connection request. For enterprise accounts and C-suite targets who ignore connection requests, InMail is sometimes your only path.
The data point that matters: InMail to someone who has engaged with your content (liked a post, viewed your profile) performs 2 to 3x better than InMail to a cold contact. If you are burning InMail credits on people who have never heard of you, you are wasting them.
LinkedIn Reply Rate Benchmark by Campaign Type
Not all outreach is equal. The type of campaign dramatically affects what “good” looks like.
Connection Request + Follow-up Sequence
This is the standard play. Send connection request, wait for acceptance, then send a value-first message, then follow up.
- Good overall sequence reply rate: 20 to 30%
- Elite: 35%+
Most replies come from the first or second follow-up, not the initial message. If you are only sending one message after connection and stopping, you are leaving replies on the table.
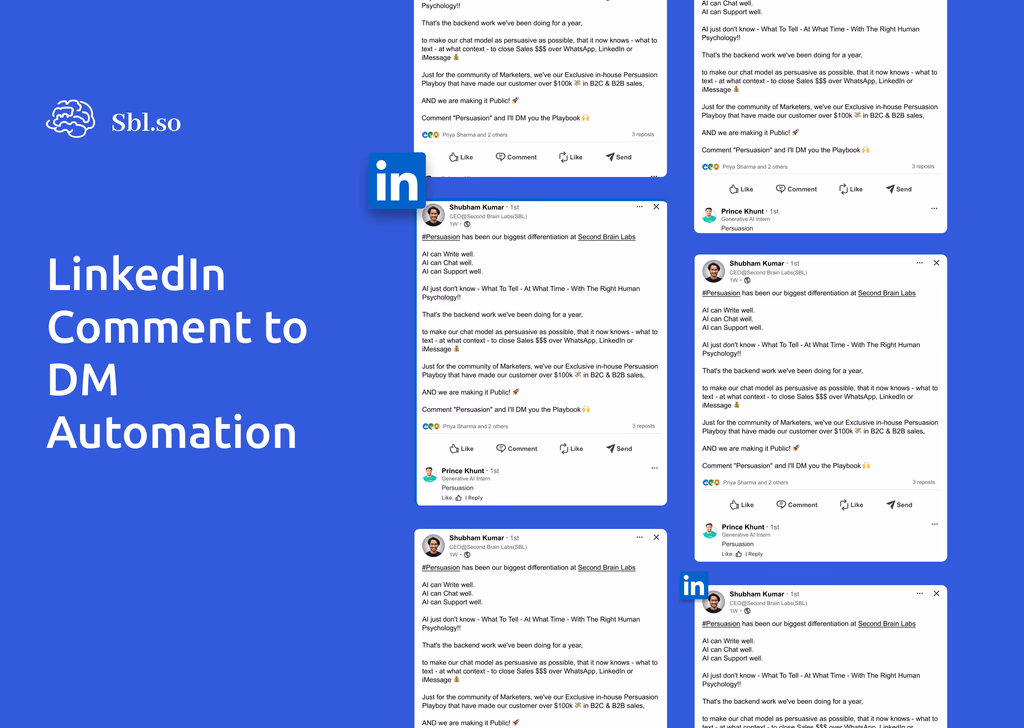
Comment-to-DM Campaigns
You have seen these. “Comment ‘AI’ and I will DM you the playbook.” These can work, but the quality of leads varies wildly.
Typical reply rates on the DM after someone comments: 40 to 60%. But the actual conversion to meetings is often lower because people who comment for free resources are not always buyers. We use comment-to-DM automation as a top-of-funnel play, not as a direct sales motion.
Warm Outreach (Engagement Before Connection)
If you like someone’s posts, comment thoughtfully, view their profile a few times, then connect, your numbers jump.
- Connection acceptance: 50 to 70%
- Reply rate: 25 to 40%
The tradeoff is volume. You cannot do this at scale manually. This is where LinkedIn automation comes in, but you need to be smart about it. Blasting likes on 500 profiles in an hour looks robotic. Spreading engagement over days looks human.
Industry-by-Industry LinkedIn Outreach Benchmarks
Here is where it gets interesting. The vertical you are targeting changes everything.
SaaS and Tech
Prospects are LinkedIn-native. They expect outreach. They also receive a lot of it.
- Connection acceptance: 30 to 40%
- Reply rate: 15 to 25%
- Positive reply rate: 8 to 15%
The challenge is differentiation. Everyone sounds the same. “Loved your recent post about AI” is now as generic as “Hope this finds you well.” You need actual specificity.
Marketing Agencies
Similar to SaaS. Agency owners and marketing directors are bombarded.
- Connection acceptance: 25 to 35%
- Reply rate: 12 to 20%
Interestingly, agency-specific messaging that acknowledges their own outbound work tends to perform better. “I know you probably get a hundred of these” type openers can work when done right.
Financial Services
More conservative, less active on LinkedIn. But when they engage, deal sizes are often larger.
- Connection acceptance: 20 to 30%
- Reply rate: 10 to 18%
Compliance concerns make people cautious about clicking links or booking calls with strangers. Trust-building takes longer.
Manufacturing and Industrial
LinkedIn adoption is lower. Many decision-makers are not checking LinkedIn daily.
- Connection acceptance: 15 to 25%
- Reply rate: 8 to 15%
For these verticals, multi-channel is essential. LinkedIn alone often is not enough. Combine with email or even phone.
Healthcare and Life Sciences
Highly regulated, cautious buyers. But also underserved by quality outreach.
- Connection acceptance: 25 to 35%
- Reply rate: 12 to 20%
If you can demonstrate compliance awareness and genuine understanding of their challenges, you stand out quickly.
Why Most LinkedIn Outreach Reply Rate Benchmarks Are Misleading
I need to be honest about something. Every benchmark I have shared has a massive asterisk.
The range between “average” and “elite” is not random variation. It is the result of compounding differences in:
- List quality
- Message personalization
- Timing
- Profile credibility
- Offer relevance
A team sending templated messages to a scraped list will sit at 5 to 8% reply. A team sending hyper-personalized messages to a hand-curated list of recently funded companies will hit 30%+. Same platform, same year, wildly different results.
This is why I get frustrated when people ask “what’s the benchmark” without context. The benchmark for your campaign depends on what you are doing. If you want to compare yourself to “average,” you are aiming too low.
LinkedIn Outreach vs Cold Email: 2026 Response Rate Comparison
Let me give you the cross-channel context because this question comes up constantly.
Average response rates in 2026:
- LinkedIn: ~10% average, 20 to 30% for good campaigns
- Cold email: ~3.5% average, 5 to 8% for good campaigns
LinkedIn outreach delivers roughly double the response rate of cold email when executed well. This makes sense. LinkedIn provides social proof, mutual connections, and professional context that email lacks.
But email has volume advantages. You can send 500 emails in a day without getting banned. Try that on LinkedIn and your account is toast. The math often works out to LinkedIn for quality, email for scale, and multi-channel for best results.
If your LinkedIn outreach is performing at or below email benchmarks (sub 5% reply), something is wrong with your targeting, messaging, or profile. You are leaving the platform’s advantages on the table.
What Affects Your LinkedIn Reply Rate the Most?
Based on running and analyzing thousands of campaigns, here is my honest ranking of what moves the needle.
1. Targeting (50% of the outcome)
If you are messaging the wrong people, nothing else matters. A perfect message to the wrong prospect is still zero replies. Invest in building tight ICP lists. Use Sales Navigator filters properly. Look at intent signals like job changes, funding, and competitor engagement.
2. Message Quality (30% of the outcome)
Short beats long. Specific beats generic. Value-first beats pitch-first. If your message could be sent to 10,000 people without changing a word, it is too generic.
3. Profile Credibility (15% of the outcome)
Before replying, prospects check your profile. No photo? Gone. “Growth hacker” in your headline? Gone. Zero content or engagement? Suspicious. Your profile is a landing page. Treat it like one.
4. Timing and Follow-ups (5% of the outcome)
Matters less than people think, but still matters. Tuesday through Thursday, 8 to 11 AM local time, tends to work best. And follow-ups are non-negotiable. Three to four touches, spaced three to seven days apart.
How to Actually Improve Your LinkedIn Outreach Reply Rates
Stop looking for hacks. Start fixing fundamentals.
Step 1: Audit your current performance
What is your connection acceptance rate? What is your reply rate? What percentage of replies are positive? If you do not know these numbers, you cannot improve them.
Step 2: Narrow your targeting
If you are targeting “marketing managers at B2B companies,” that is too broad. Try “marketing managers at B2B SaaS companies with 50 to 200 employees who recently raised Series A.” Smaller list, higher reply rate.
Step 3: Rewrite your messages around their problem, not your solution
Nobody cares about your product. They care about their problems. Lead with what you have observed about their situation, not what you sell.
Step 4: Send more follow-ups
Most people stop after one message. The data consistently shows that replies cluster around follow-ups two and three. Persistent but not annoying.
Step 5: Track and iterate
Run A/B tests on messages. Track which segments reply more. Double down on what works. This is not a one-time setup. It is an ongoing optimization process.
Volume Limits: How Many LinkedIn Messages Can You Send in 2026?
The benchmarks above assume you are not getting banned. Volume matters.
Safe daily limits in 2026:
- Connection requests: 10 to 20 per day per profile (premium accounts can push slightly higher)
- Messages to connections: Up to 100 per day, but 50 to 75 is safer for cold outreach
- InMails: Limited by your credits, typically 50 to 100 per month depending on plan
If you want to scale beyond what one profile can safely do, you need multiple profiles. This is where teams use profile rental services or build internal SDR teams with individual accounts.
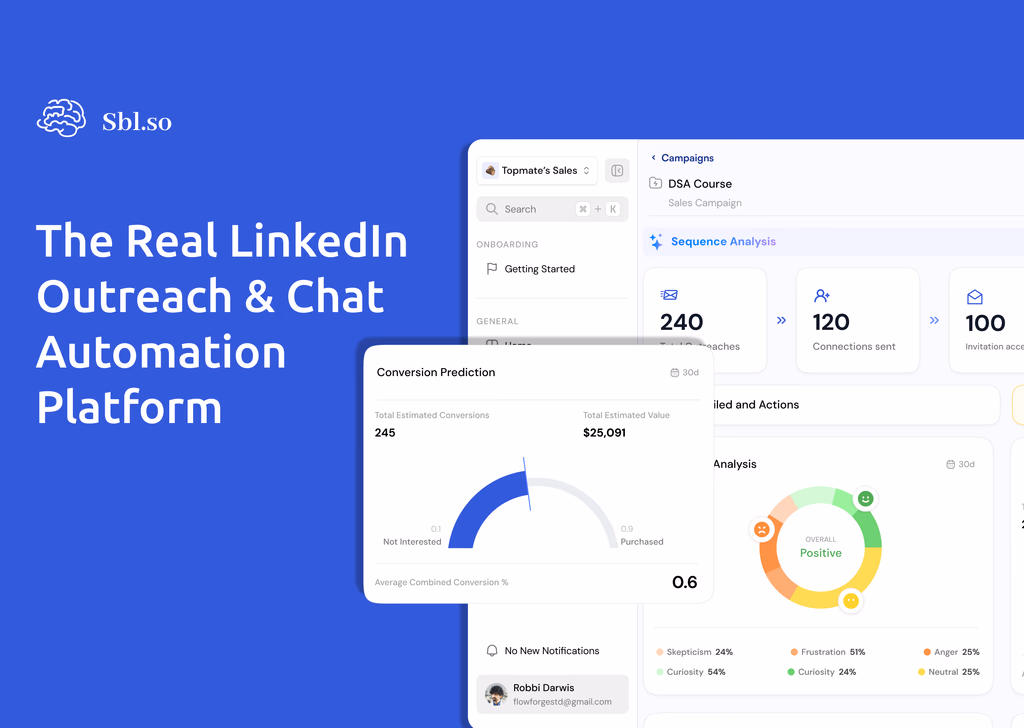
At Sbl.so, we rotate across multiple connected profiles automatically. When one profile hits its daily limit, the next one takes over. That is how we achieve higher volume without getting any single account restricted. We have hit up to 75 new connections per day and 200 messages to first-degree connections across our account rotation system.
The Benchmarks Nobody Talks About: Positive Reply Rate and Meeting Conversion
Reply rate is a vanity metric if half your replies are “not interested” or “please remove me from your list.”
What matters downstream:
- Positive reply rate: 20 to 40% of total replies should be interest signals (“tell me more,” “sure, let’s chat,” or booking a call)
- Meeting conversion: 2 to 5% of total prospects messaged booking a meeting is solid. 5%+ is excellent.
This is why tracking only reply rate is dangerous. You could optimize for more replies by being more aggressive or provocative, but tank your positive reply rate and meeting conversion.
The ultimate benchmark? Revenue per 1,000 prospects messaged. That is the number that actually matters for your business.
2026 Trends Affecting LinkedIn Outreach Benchmarks
A few shifts worth noting as you plan your outreach strategy.
Buyer Fatigue is Real
More people are doing LinkedIn outreach. Prospects are more skeptical. The bar for what counts as “personalized” keeps rising. What worked in 2023 feels templated now.
Quality Over Volume
Platform limits and account restrictions are pushing teams toward smaller, better-targeted campaigns. The spray-and-pray era is ending. Teams that invest in data enrichment and intent signals are pulling away.
Multi-Channel is Default
Top performers are rarely LinkedIn-only. They combine LinkedIn with email, sometimes with WhatsApp or phone. Single-channel outreach is leaving money on the table.
AI is Changing the Game
Not the fake “AI” that is just scheduled templates. Actual AI that can handle conversations, respond to objections, and qualify leads in real-time. This is what we built Sbl.so to do. The system does not just send messages. It chats, follows up, handles objections, and books calls. That is why our reply rates stay high even at scale.
Final Thoughts: What Good LinkedIn Outreach Looks Like in 2026
Here are the benchmarks to hold yourself to:
- Connection acceptance: 30 to 45% minimum, aim for 40%+
- First-touch reply rate: 18 to 25% for good, 30%+ for elite
- Overall sequence reply rate: 25 to 35%
- Positive reply rate: 10 to 15% of total messaged
- Meeting conversion: 2 to 5% of total messaged
If you are below these numbers, the problem is almost always targeting or messaging. Fix those first before blaming the channel or looking for new tools.
And if you are spending hours managing sequences, writing templates, and manually replying to prospects, maybe it is time to rethink your approach. The best performing teams in 2026 are automating the grunt work and focusing their time on actual conversations that matter.
That is exactly what we built Sbl.so to handle. Not just sending messages, but actually running the entire conversation until a meeting is booked. Across 285,000+ messages, we are averaging 18% reply rates and letting the AI handle the back-and-forth. It is the closest thing to having an SDR team without actually hiring one.
But whether you use our tool or not, the benchmarks in this post are real. Use them to measure yourself honestly. And then do the work to improve.